Winter tests: Statistics
The tests did not prove as challenging as the 2014 regulation overhaul, but avoiding problems altogether was still impossible. Every team experienced setbacks, and while overall mileage was solid, performance and consistency were far from evenly matched.
Lap Times
Until the final day, teams largely kept their true pace hidden. A clearer picture will only emerge on Saturday morning of the Australian Grand Prix during qualifying. That said, the early indications suggest a three-way fight between Ferrari, Mercedes, and McLaren — with Ferrari holding a noticeable advantage on outright pace.
The gaps between teams were significant. Alongside debutant Cadillac, Aston Martin also found itself clearly off the leading pace.
| № | Driver | Team | Lap time | Day | Tyre |
| 1 | Charles Leclerc | Ferrari | 1:31.992 | 6 | C4 |
| 2 | Kimi Antonelli | Mercedes | 1:32.803 | 5 | C3 |
| 3 | Oscar Piastri | McLaren | 1:32.861 | 5 | C3 |
| 4 | Lando Norris | McLaren | 1:32.871 | 6 | C4 |
| 5 | Max Verstappen | Red Bull | 1:33.109 | 6 | C3 |
| 6 | George Russell | Mercedes | 1:33.197 | 4 | C3 |
| 7 | Lewis Həmilton | Ferrari | 1:33.408 | 5 | C3 |
| 8 | Pierre Gasly | Alpine | 1:33.421 | 6 | C5 |
| 9 | Oliver Bearman | Haas | 1:33.487 | 6 | С4 |
| 10 | Gabriel Bortoleto | Audi | 1:33.755 | 6 | C4 |
| 11 | Franco Colapinto | Alpine | 1:33.818 | 5 | C5 |
| 12 | Nico Hülkenberg | Audi | 1:33.987 | 5 | C4 |
| 13 | Arvid Lindblad | Racing Bulls | 1:34.149 | 6 | C4 |
| 14 | Esteban Ocon | Haas | 1:34.201 | 5 | C4 |
| 15 | Isack Hadjar | Red Bull | 1:34.260 | 4 | С4 |
| 16 | Carlos Sainz | Williams | 1:34.342 | 6 | C5 |
| 17 | Liam Lawson | Racing Bulls | 1:34.532 | 5 | С4 |
| 18 | Alexander Albon | Williams | 1:34.555 | 5 | C5 |
| 19 | Valtteri Bottas | Cadillac | 1:35.290 | 6 | C3 |
| 20 | Sergio Perez | Cadillac | 1:35.369 | 5 | C5 |
| 21 | Lance Stroll | Aston Martin | 1:35.974 | 4 | C3 |
| 22 | Fernando Alonso | Aston Martin | 1:36.536 | 4 | С3 |
Laps
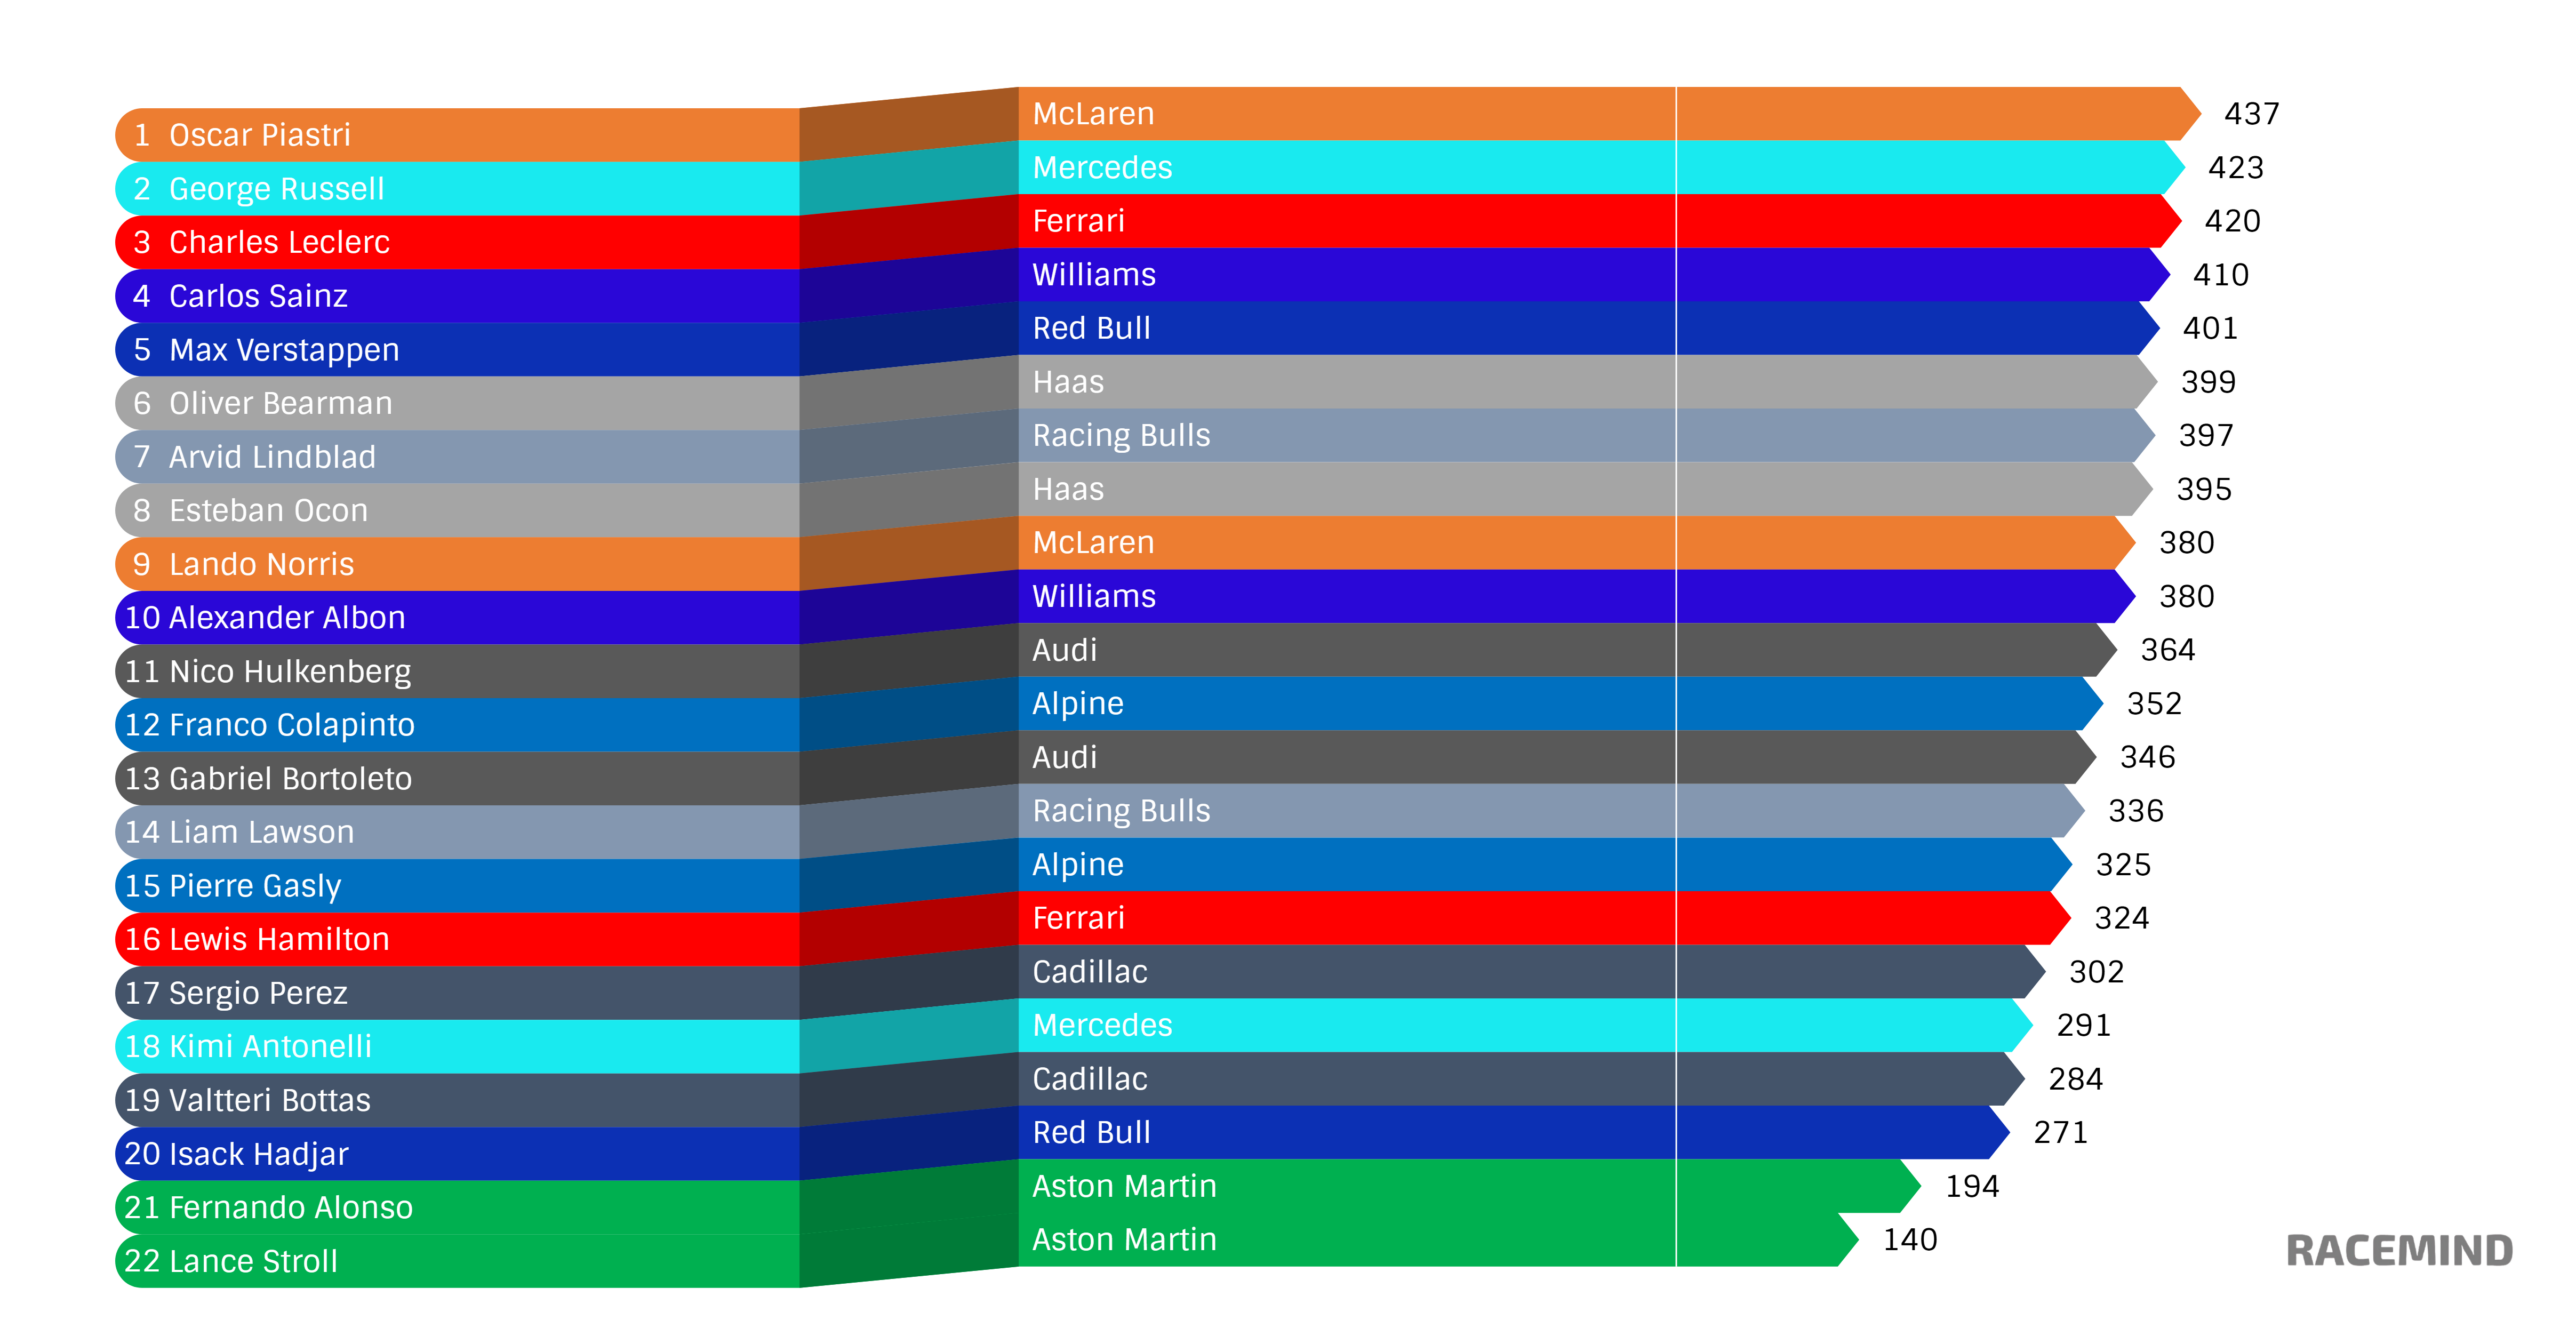
By Drivers
Aston Martin also struggled in terms of mileage. The team completed almost no meaningful running on the final day. Only the drivers from Cadillac finished with fewer total laps than Aston Martin’s drivers.
Apart from a few drivers who lost time due to temporary issues, most managed to complete a satisfactory amount of running. Oscar Piastri completed the highest number of laps.
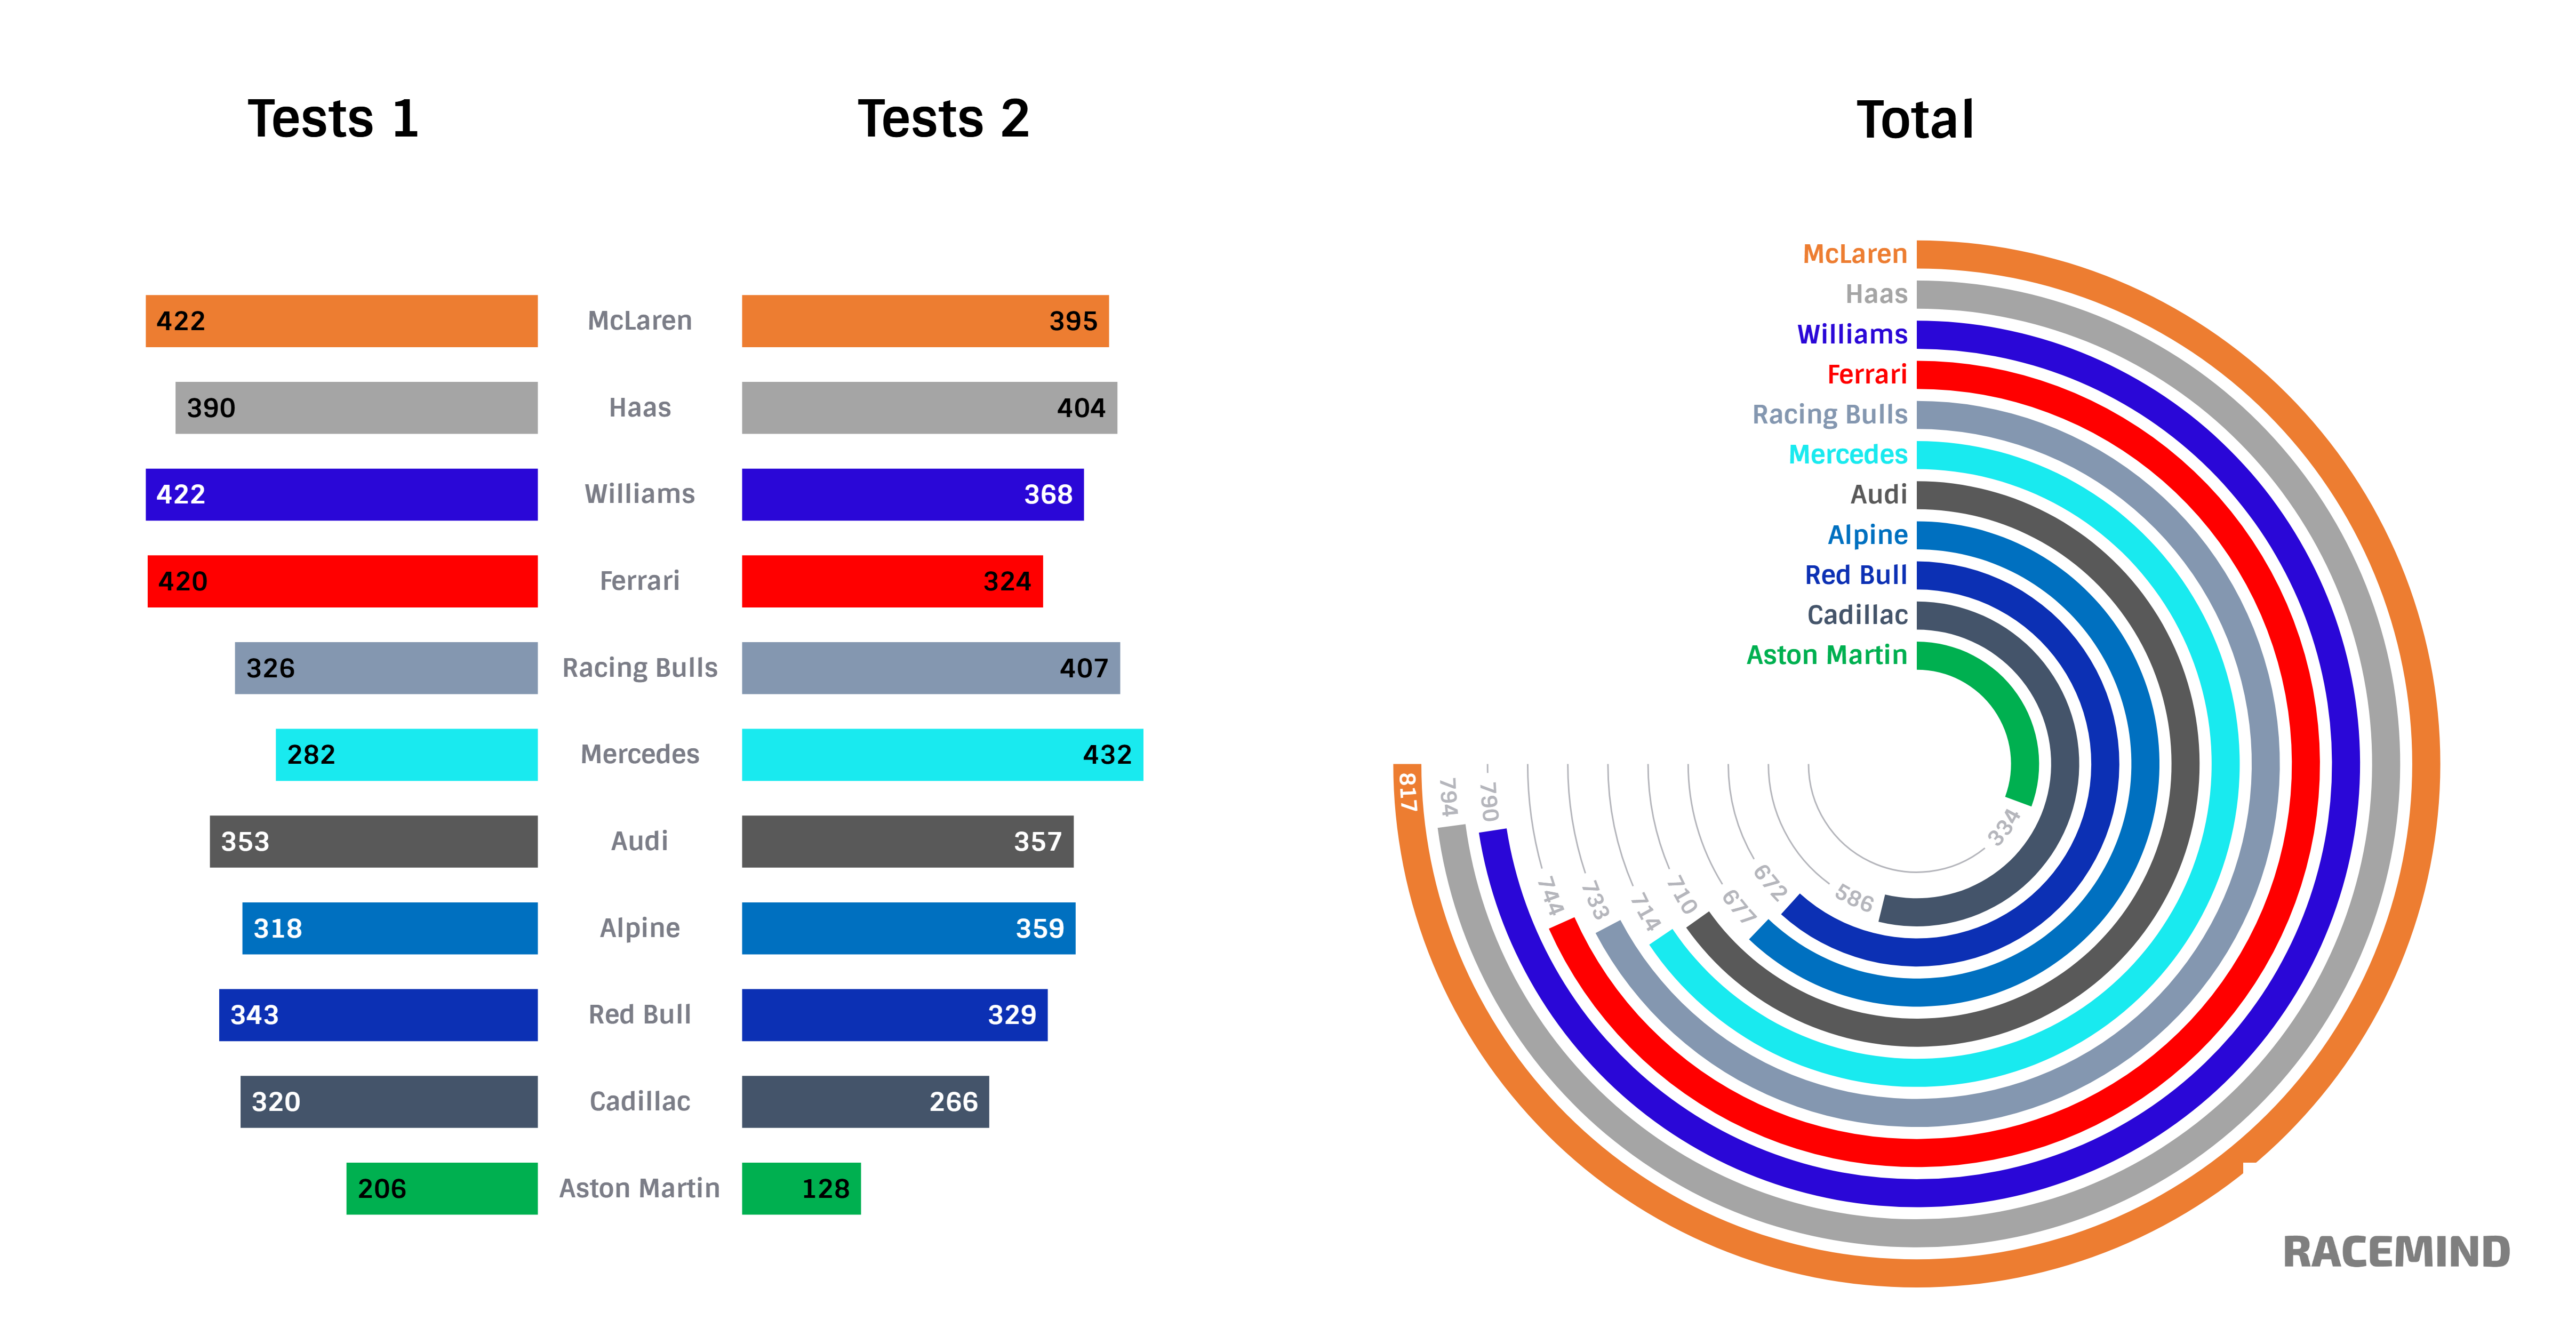
By Teams
As mentioned earlier, the overall picture differs from 12 years ago. Most teams were able to cover long distances this time. While reliability issues increased as performances intensified toward the end of the program, many appeared better prepared for the new regulations compared to previous overhaul periods.
Reigning champions McLaren topped the mileage charts, while Haas and Williams were pleasant surprises. Interestingly, Mercedes did not make it into the top five for total laps completed.
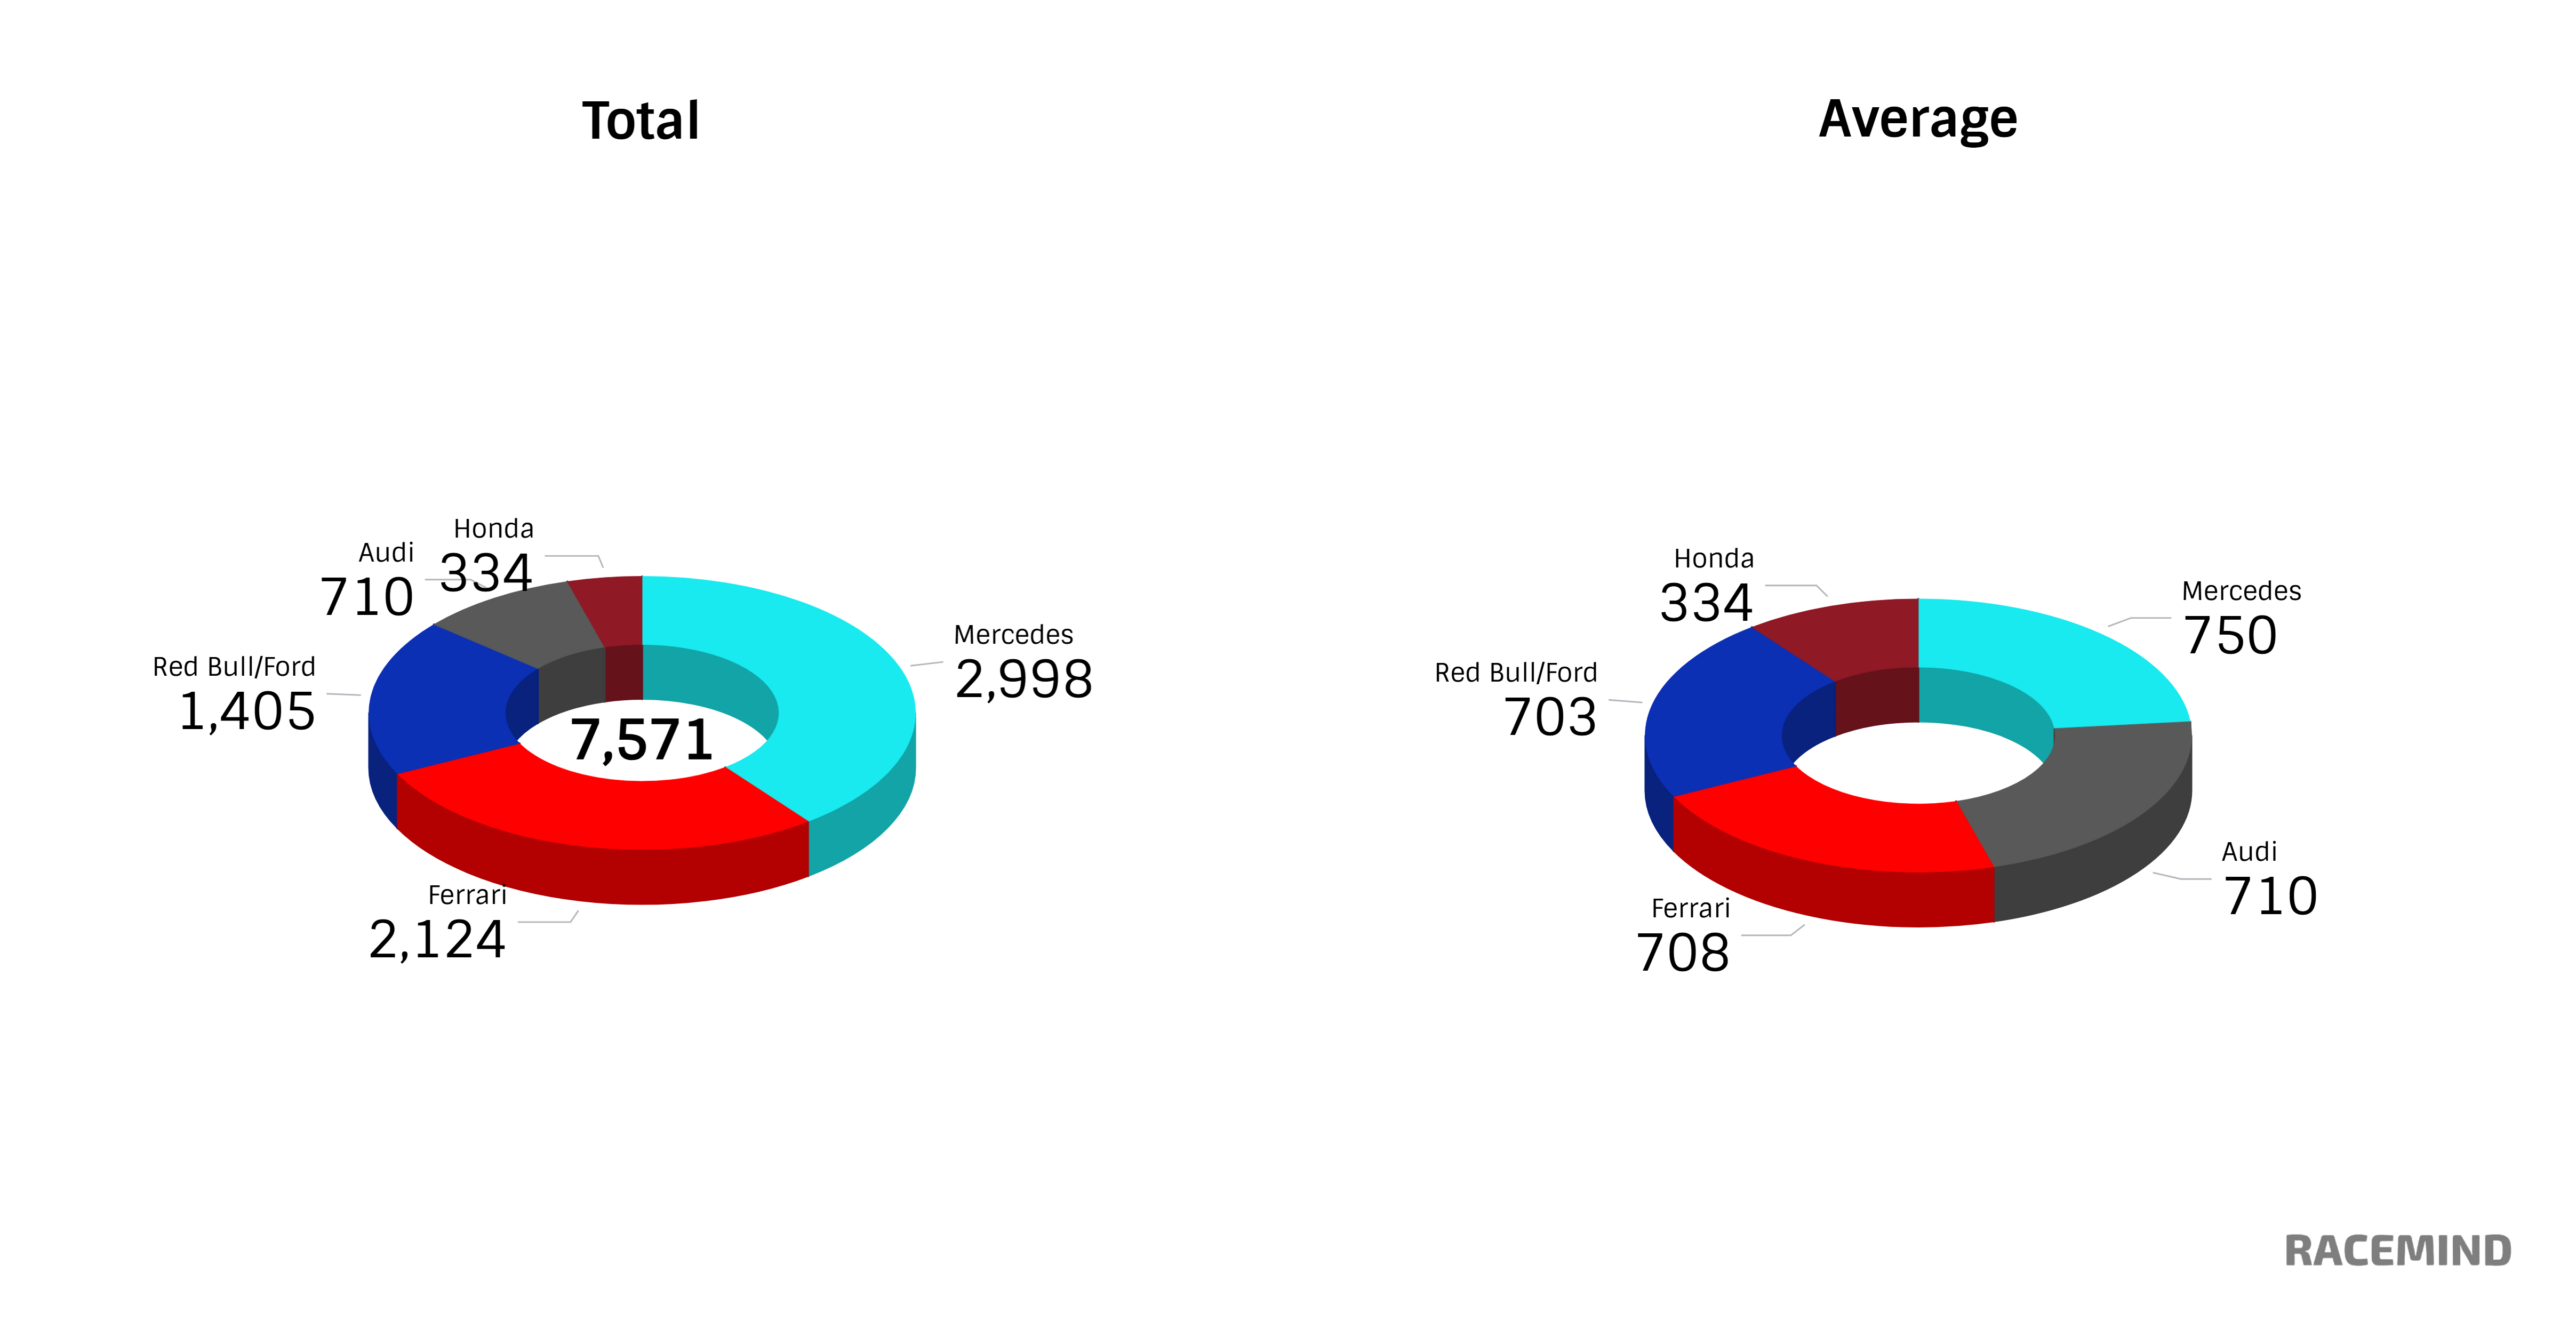
By Power Unit
Mercedes supplied engines to its works team and three customer teams, allowing it to gather a significant amount of data. Representing eight cars increases the likelihood of encountering issues, yet Mercedes-powered teams still led the way overall, averaging around 750 laps.
Ferrari ranked second in total distance covered, but when divided by the number of teams supplied, they fell behind Audi in average mileage per team.